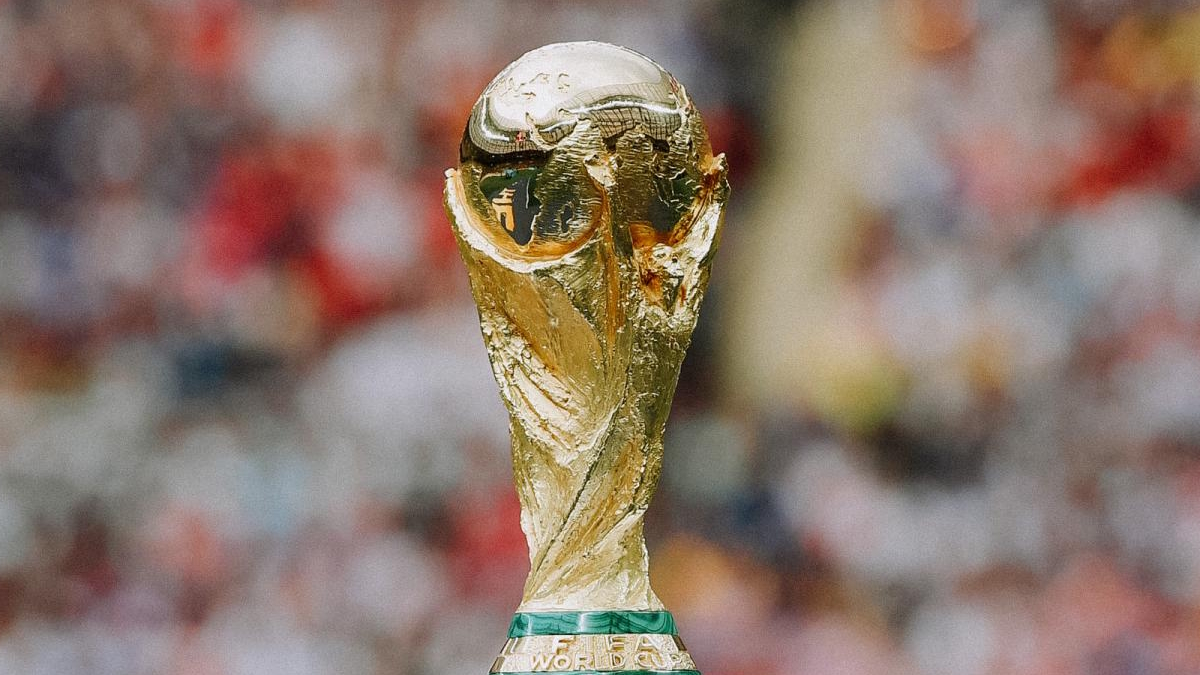
The World Cup that kicks off in a month will look almost nothing like the one Uruguay won 96 years ago. Thirteen teams crammed into a single Montevideo summer have become forty-eight nations spread across three countries. Eighteen matches have become one hundred and four. And a tournament that averaged nearly four goals a game in 1930 now hovers steadily around 2.6.
The 2026 expansion is not just bigger, it is the sixth distinct format the World Cup has worn. Here is how the numbers have shifted - the eras, the records, the slow rebalancing of football's centre of gravity - in the charts and stories that the previous twenty-two finals have left behind.
Six Tournaments in One
The World Cup is not really one competition. It is six, stitched together by tradition and a trophy. Each era brought a new shape, a new number of teams, and its own rhythm of goals.
The Founding
Uruguay invented the format on the fly. Thirteen teams, four pools of varying size, then a straight knockout to the final. Argentina lost 4-2 at home in Montevideo.
The Pure Knockout
Two editions in Europe ran as straight elimination from the round of 16. No second chances. Lose your opening game and your tournament was over after ninety minutes.
The Sixteen Era
Group stages returned in 1950 and the sixteen-team mould stayed for nearly three decades. Eight European, four South American slots, the rest carved up between the other continents.
The Twenty-Four
1982 brought the awkward 24-team format with a second group stage and only twelve qualifiers from the openers. It also gave Africa and Asia their first proper foothold.
The Modern Cup
From France 1998 to Qatar 2022, the 32-team format settled the tournament into the rhythm fans recognise today: eight groups of four, then a straight knockout from the round of sixteen.
The Expansion
2026 introduces twelve groups of four, a round of thirty-two, and a tournament played across the USA, Canada and Mexico. By far the biggest reshape since the 24-team experiment in 1982.
From Eighteen Games to One Hundred and Four
The bars are matches played, the line is teams competing. Notice the step changes - 1982 jumped to 24 teams, 1998 doubled the entry to 32, and 2026 will hit 48. The 2026 column is shown in solid green: it has not been played yet.
The 2026 finals will play 5.8 times as many matches as the 1930 tournament that started it all. Eighteen games has become 104.
The new format adds a round of thirty-two before the round of sixteen. Total games jump 63%, from 64 in Qatar to 104 across North America.
Up from 32 since 1998. The biggest single-edition jump in the tournament's history, and the first format change in twenty-eight years.
Where Did the Goals Go?
The most striking pattern in World Cup history is the collapse in scoring. The first five tournaments averaged over four goals a game. The last ten have not topped three. Tactical evolution, fitter defenders, and the spread of pragmatic football to all corners of the globe have flattened the numbers permanently.
The highest-scoring World Cup ever. 140 goals in 26 games, including a 7-5, a 9-0, and Austria 7-5 Switzerland in the quarters. No tournament has come close since.
The all-time low. Defensive football reached its peak in Italia '90, with West Germany winning a 1-0 final against Argentina and the tournament drowning in caution.
2.61 goals per game across all 22 editions and 1,162 matches. The modern era has stabilised remarkably close to this number, edition after edition.
The Map Got Bigger
For thirty years the World Cup was effectively Europe versus South America with a polite nod to everyone else. The shift began in 1982 with FIFA's 24-team expansion, and accelerated through the 1990s. Asia and Africa together had four teams in 1990. They will have at least twelve in 2026.




The Rise of the Stalemate
Group games can be drawn. Knockouts cannot. As group play has grown, so has the share of matches that finish level. The first four tournaments produced exactly four draws between them. Modern editions routinely top fifteen.
For the first seven World Cups, every single match produced at least one goal. The very first goalless game in tournament history was Brazil 0-0 England at Sweden 1958. It took 28 years.
Extra Time and Shootout Drama
Knockout games that cannot be settled in ninety minutes are a modern staple. Extra time has been a fixture since 1934, but penalty shootouts only arrived at the World Cup in 1986. Each tournament since 1990 has produced at least one - 2022 had five.
Austria beat France 3-2 after extra time in the round of 16 at the 1934 finals - the first World Cup game to need the extra thirty minutes.
Mexico 1986. France beat Brazil 4-3 on penalties in the quarter-final after a 1-1 draw. Three more shootouts followed at the same tournament, opening a door that never closed.
The Upset Index
An upset is any game where the lower-rated team takes points off the favourite. The rate has climbed steadily as smaller nations have closed the gap. 2002 and 2022 stand out as particularly chaotic - Senegal beating France, Japan beating Germany and Spain, Saudi Arabia beating Argentina.
Both Teams Scored - or Nobody Did
Two patterns tell you a lot about a tournament's character. How often did both teams score? How often did neither? The bars track the share of games where both sides got on the scoresheet. The line tracks goalless draws - rare in the high-scoring early years, common during the defensive lull of the 1970s, and stubbornly present in modern times.
The Character of Four Tournaments
Four editions, four different World Cups. 1954 was a goal feast. 1990 was a defensive grind. 2002 was the great upset year, with co-hosts South Korea reaching the semi-finals. 2022 was modern chaos - high scoring, full of shocks, and a record five penalty shootouts.
New Flags at the Party
Eighty-seven different nations have played in a World Cup. Some editions have been full of fresh faces - the inaugural tournament, of course, but also 1934 (10 debutants in a 16-team field) and 2006 (8 newcomers including Côte d'Ivoire, Ghana, and Trinidad and Tobago). Other tournaments are tight-knit reunions of the same regulars.
Asia's first ever World Cup participant. Played one game in 1938, lost 6-0 to Hungary, and never returned. The country became Indonesia after independence.
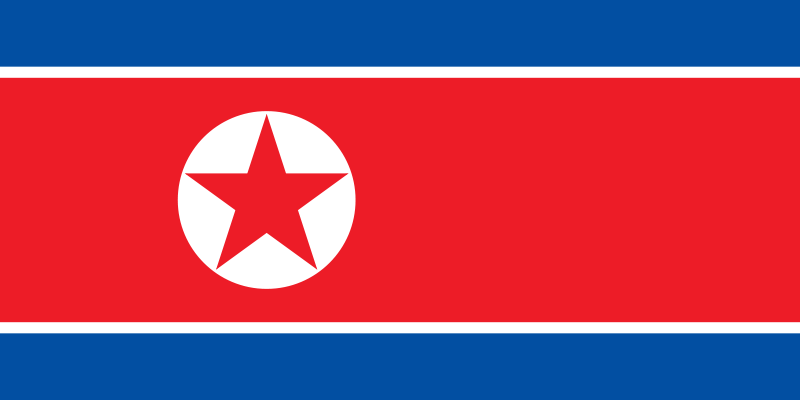
The shock of 1966. Eliminated Italy in the group stage and led Portugal 3-0 in the quarters before Eusébio scored four to win it 5-3.
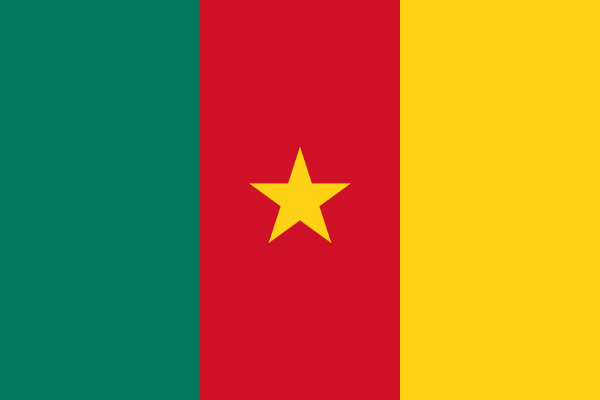
Africa's first quarter-finalists came in 1990, but the Indomitable Lions actually debuted in 1982 - going unbeaten in three group games against Italy, Poland and Peru.
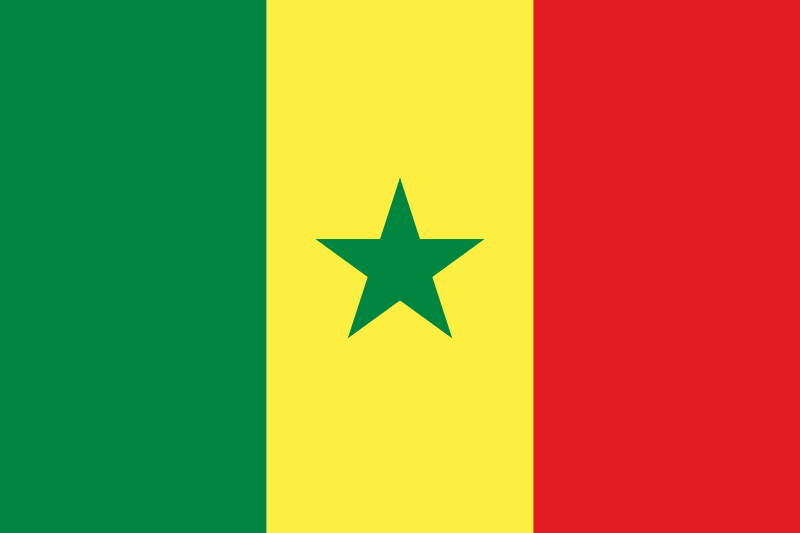
Reached the quarter-finals on debut in 2002, beating defending champions France in the opening game. One of the great underdog runs in tournament history.
Every Edition, Side by Side
The complete record, edition by edition. Watch the team count rise, the goal averages slide, the extra-time count grow, and the upset numbers refuse to settle down.
| Year | Teams | Games | Goals | Avg | Draws | 0-0 | AET+PSO | Upsets |
|---|---|---|---|---|---|---|---|---|
| 1930 | 13 | 18 | 70 | 3.89 | 0 | 0 | 0 | 2 |
| 1934 | 16 | 17 | 70 | 4.12 | 1 | 0 | 3 | 7 |
| 1938 | 15 | 18 | 84 | 4.67 | 3 | 0 | 5 | 3 |
| 1950 | 13 | 22 | 88 | 4.00 | 3 | 0 | 0 | 8 |
| 1954 | 16 | 26 | 140 | 5.38 | 2 | 0 | 3 | 5 |
| 1958 | 16 | 35 | 126 | 3.60 | 10 | 2 | 1 | 11 |
| 1962 | 16 | 32 | 89 | 2.78 | 5 | 4 | 0 | 8 |
| 1966 | 16 | 32 | 89 | 2.78 | 5 | 3 | 1 | 6 |
| 1970 | 16 | 32 | 95 | 2.97 | 5 | 3 | 3 | 5 |
| 1974 | 16 | 38 | 97 | 2.55 | 10 | 5 | 0 | 7 |
| 1978 | 16 | 38 | 102 | 2.68 | 9 | 6 | 1 | 10 |
| 1982 | 24 | 52 | 146 | 2.81 | 17 | 7 | 2 | 13 |
| 1986 | 24 | 52 | 132 | 2.54 | 14 | 4 | 8 | 10 |
| 1990 | 24 | 52 | 115 | 2.21 | 12 | 5 | 12 | 14 |
| 1994 | 24 | 52 | 141 | 2.71 | 11 | 3 | 7 | 16 |
| 1998 | 32 | 64 | 171 | 2.67 | 19 | 4 | 7 | 14 |
| 2002 | 32 | 64 | 161 | 2.52 | 16 | 3 | 7 | 20 |
| 2006 | 32 | 64 | 147 | 2.30 | 15 | 7 | 10 | 14 |
| 2010 | 32 | 64 | 145 | 2.27 | 16 | 7 | 6 | 13 |
| 2014 | 32 | 64 | 171 | 2.67 | 13 | 7 | 12 | 11 |
| 2018 | 32 | 64 | 169 | 2.64 | 13 | 1 | 9 | 18 |
| 2022 | 32 | 64 | 172 | 2.69 | 15 | 7 | 10 | 19 |
What 2026 Will Bring
For only the second time in World Cup history, the bracket gets a new round. Twelve groups of four will send the top two plus the eight best third-placed teams into a brand new round of thirty-two. From there it is the familiar knockout path.
Asia jumps from four guaranteed slots to eight. Africa from five to nine. CONCACAF from three (plus the host) to six. The expansion is not just bigger, it is significantly more global. If the trends in this article hold - more debutants, more upsets, more goals than 1990 but fewer than 1954 - the United States, Canada and Mexico are about to host the messiest, most unpredictable World Cup yet.
Source data covers every match in the FIFA World Cup finals from 1930 to 2022. Group and knockout phase totals are combined for tournament-level figures. Participant counts use the maximum across phases (i.e. the number of teams that began the tournament). 2026 figures are based on FIFA's published format.